Advanced Technical Analysis Charts
Providing market hot spots in breakthrough advanced technical analysis charts for informed trading decisions.
Welcome to
Hi-Tech Charts
Nasdaq late August 2025 forecast
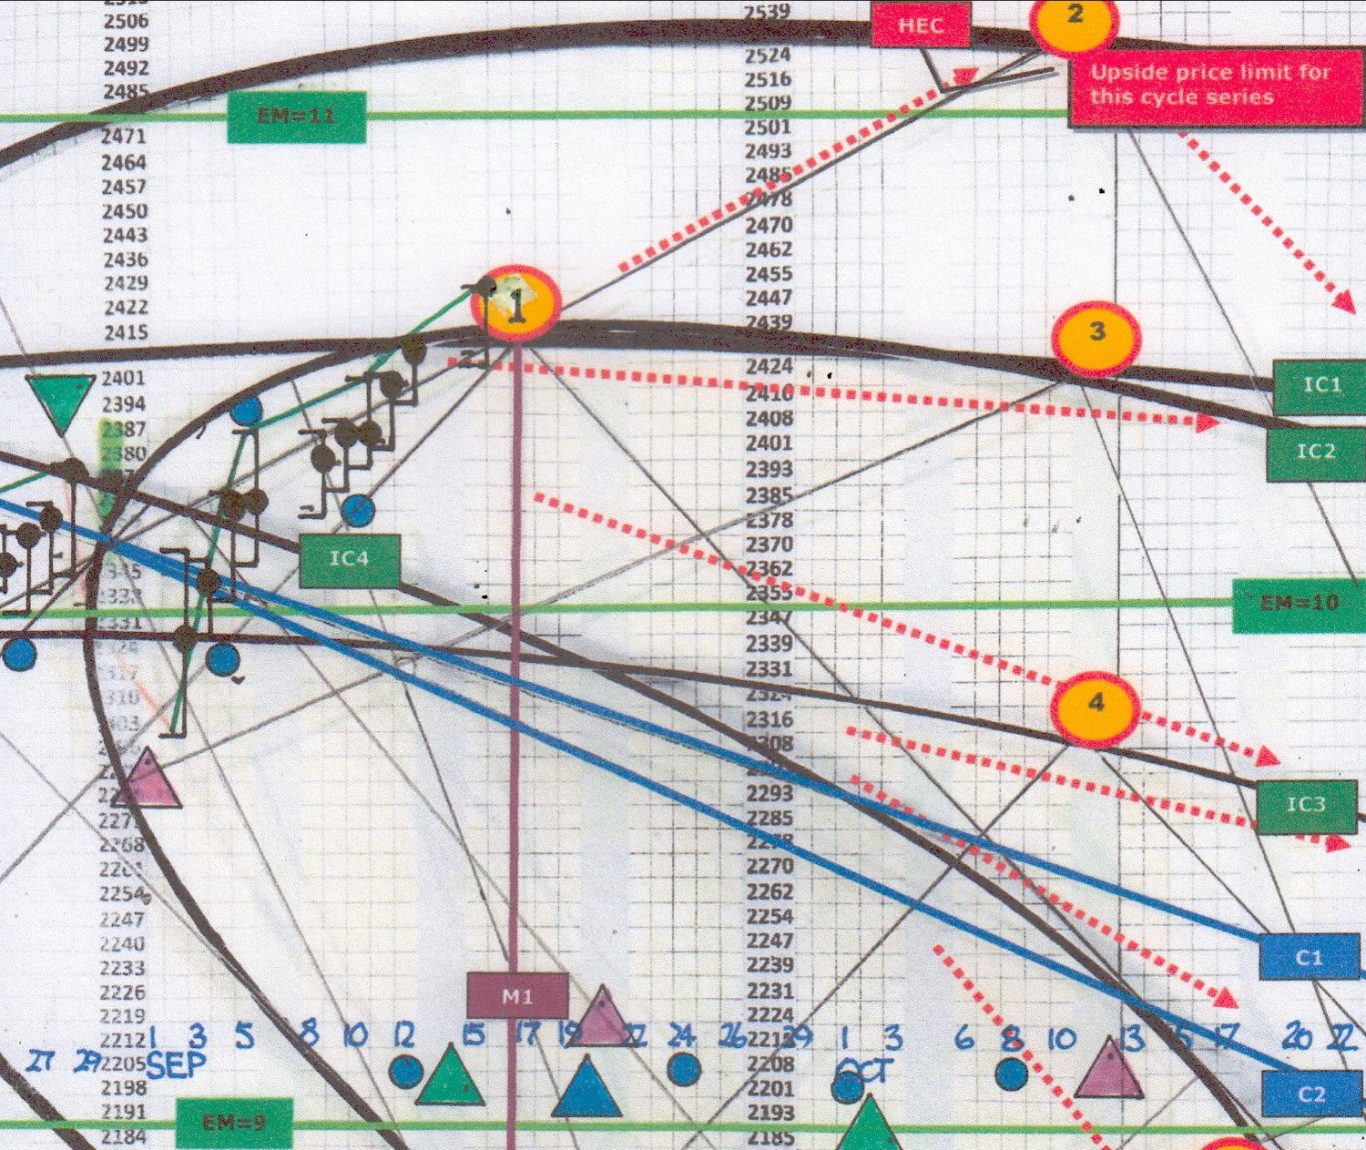
This Hi-Tech Chart analyis indicates Nasdaq will be trapped in the IC1/IC3 channel, or if price extends above IC1, expect a run up to HEC where resistance has the potential to halt higher price, most likely at target 2. IC lines are major support and resistance lines and assist traders trading from tops and bottoms of channels. Red dotted arrows indicate likely price action direction - analysis invaluable for both intra-day and trend followers. Experience clarity with advanced charting tools.
Craft your financial future with informed insights.
35
Years of Expertise
20 years
Satisfying Clients
30
Charts Analyzed
Breakthrough technology & Charting Tools
British Pound
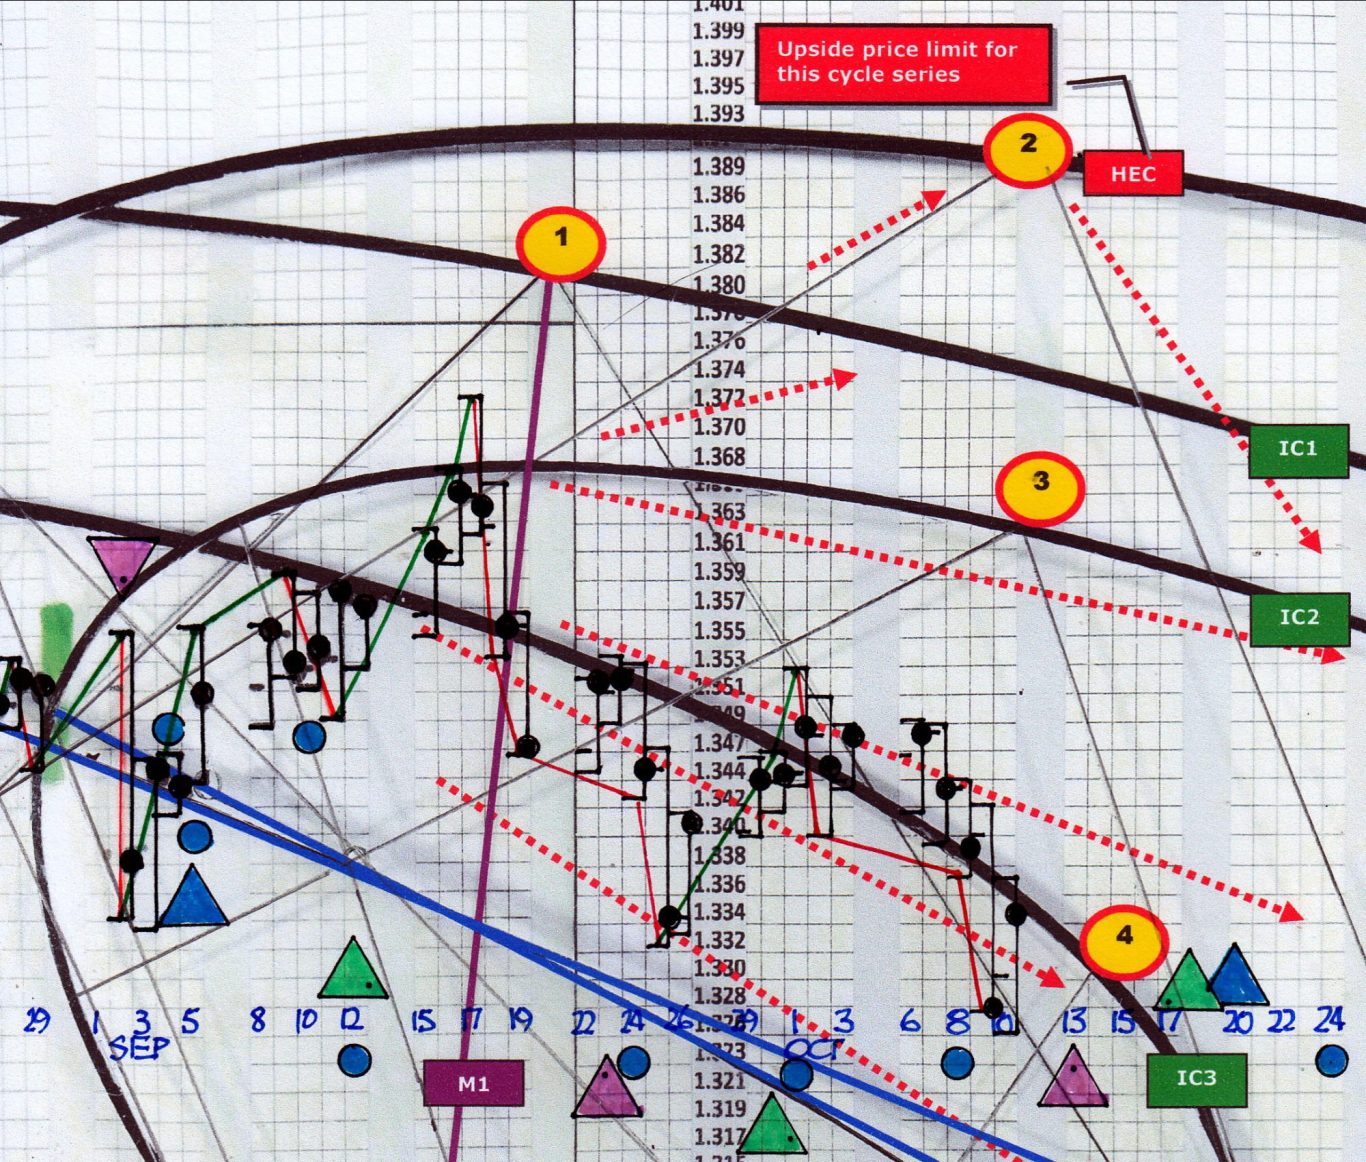
GBP makes a major to top at powerful overhead resistance line IC2. These lines not only pin-point tops but identify channels a market will trade in, making trade management less stressful. A short from the 17th September top could have been held as long as closes remained below IC2.
Hi-Tech Charts improve trading profits and takes the stress off traders
FREE
samples of Hi-Tech Charts posted here weekly
Here we give traders the opportunity to test the value of Hi-Tech Charts as a convenient way to judge if your trading performance can be improved. Each Monday morning we post a sample across a variety of markets from commodities, stock indices, currencies, crypto and rates. Each one represents a high priority 'market hot spot'. The chart at left is only one part of our daily bulletin - to get the full daily bulletin FREE for 14 days email us:
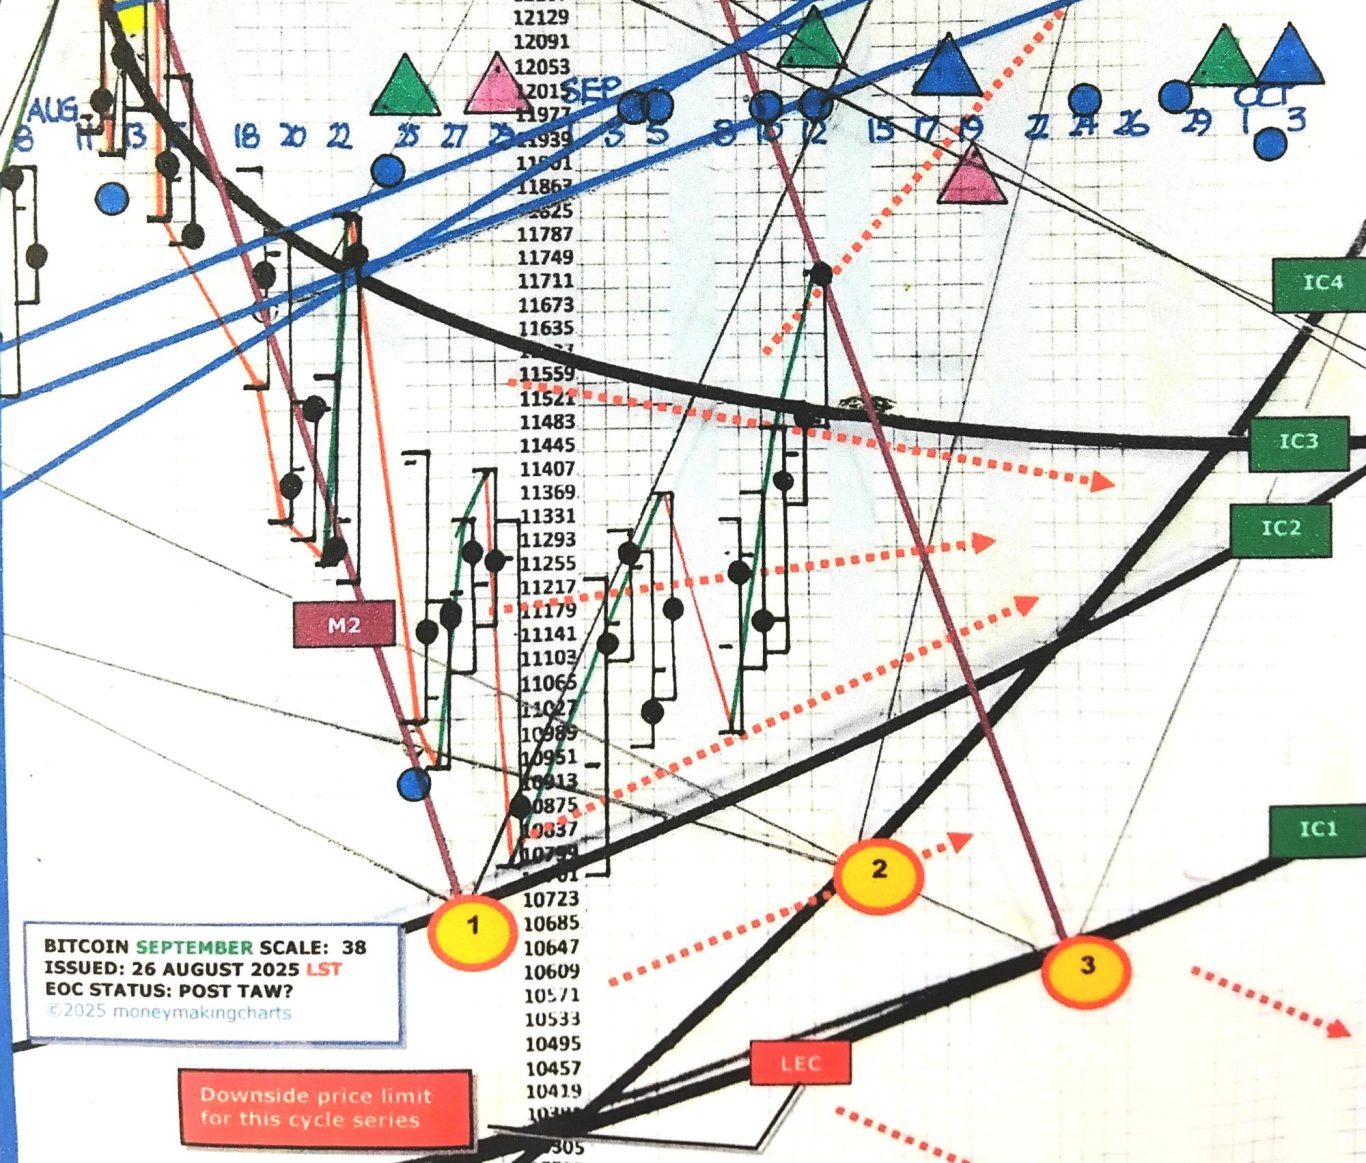
Bitcoin October Futures
Bitcoin made a major top on 14th August 2025 at a major overhead resistance line, signalling a short trade at around 125000 (top left of chart). The M1 line is a powerful down force line and dragged price down to strong support from IC2, signalling a reversal from short to long around 109000. Accurate support and resistance lines greatly assist traders'.
Hi-Tech Charts are loaded with multiple trading tools
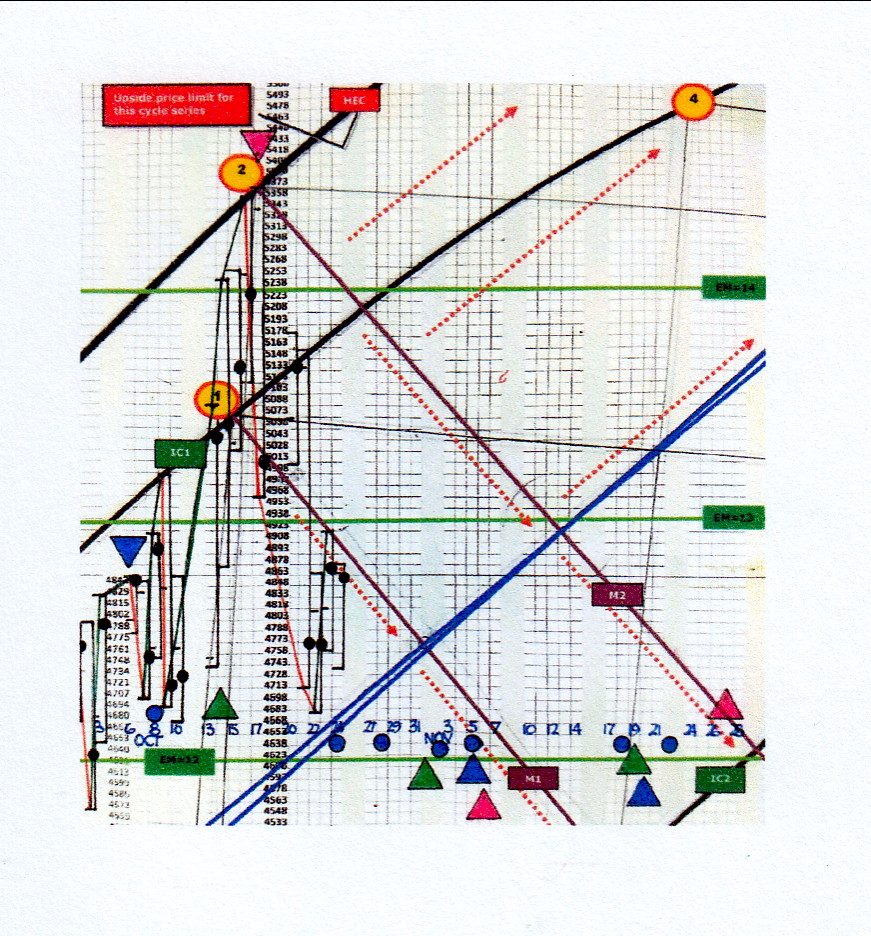
Silver ended a $17 rise from June 2025 and the final top is clearly signalled in this Hi-Tech Chart. There were three elements high lighting a short signal:
- Price at the extreme upper limits of bull cycles - HEC
- Price hitting target 2
- The top on 17th October occurred at our exclusive EM timing cycles showing in our charts as coloured triangles. A blue & green triangle also occurred at the top of 6th October and bottom at 14th October.
Overhead resistance lines create trade entries
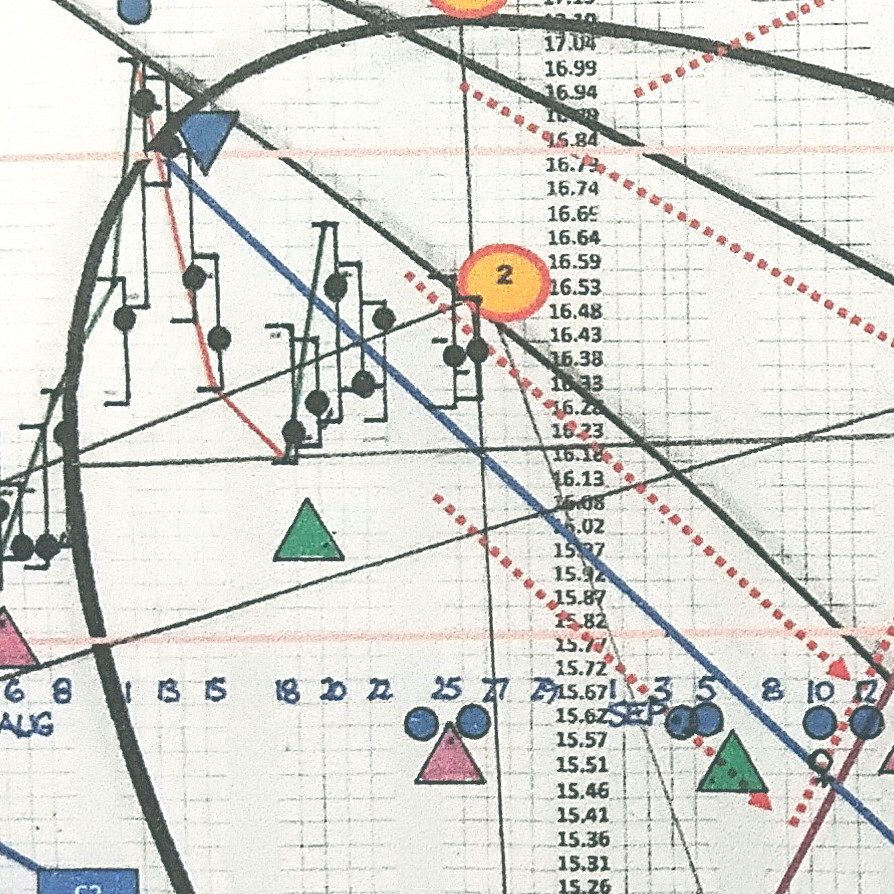
On 12th August 2025, Sugar presented a strong short signal at around 17.00, topping at strong overhead resistance coupled with two timing pivot points. A trader was able to stay short while price remained below the primary resistance line. Hi-Tech Charts signalled an exit at around 15.50 on 8th September - a profitable, low stress trade.
Email us
Email us to take advantage of our FREE 14 day trial and receive daily bulletins of our selection of Hi-Tech Charts market hot spots.
Crude Oil makes a major bottom at the extreme lowest support line in this cycle series, signalling a long entry around 56.80. Target 2 is likely to be hit.

Get in touch
E-mail: markethotspots@gmx.com
Address: Buckinghamshire, United Kingdom